Explore elements with an interactive periodic table. Click any element for atomic mass, electron configuration, oxidation states, and trends. Free, no signup, works in your browser.
The periodic table is the most important reference in chemistry — but a printed poster can only show so much. An interactive periodic table lets you click any element and instantly pull up atomic mass, electron configuration, oxidation states, melting point, and more. This guide explains what an interactive table can do, how to use it, and why it beats a static chart for learning and lab work.
Why an Interactive Periodic Table?
A standard periodic table prints each element's symbol, name, atomic number, and atomic mass. That's enough for a quick glance, but chemists constantly need more:
Electron configuration for bonding and orbital diagrams
Oxidation states for balancing redox reactions
Melting and boiling points for lab planning
Electronegativity for predicting bond polarity
Group and period trends for understanding chemical behavior
An interactive table puts all of this one click away. Instead of flipping between a textbook, a data sheet, and Google, you hover or click an element and get everything in one place.
What You Can Do With an Interactive Table
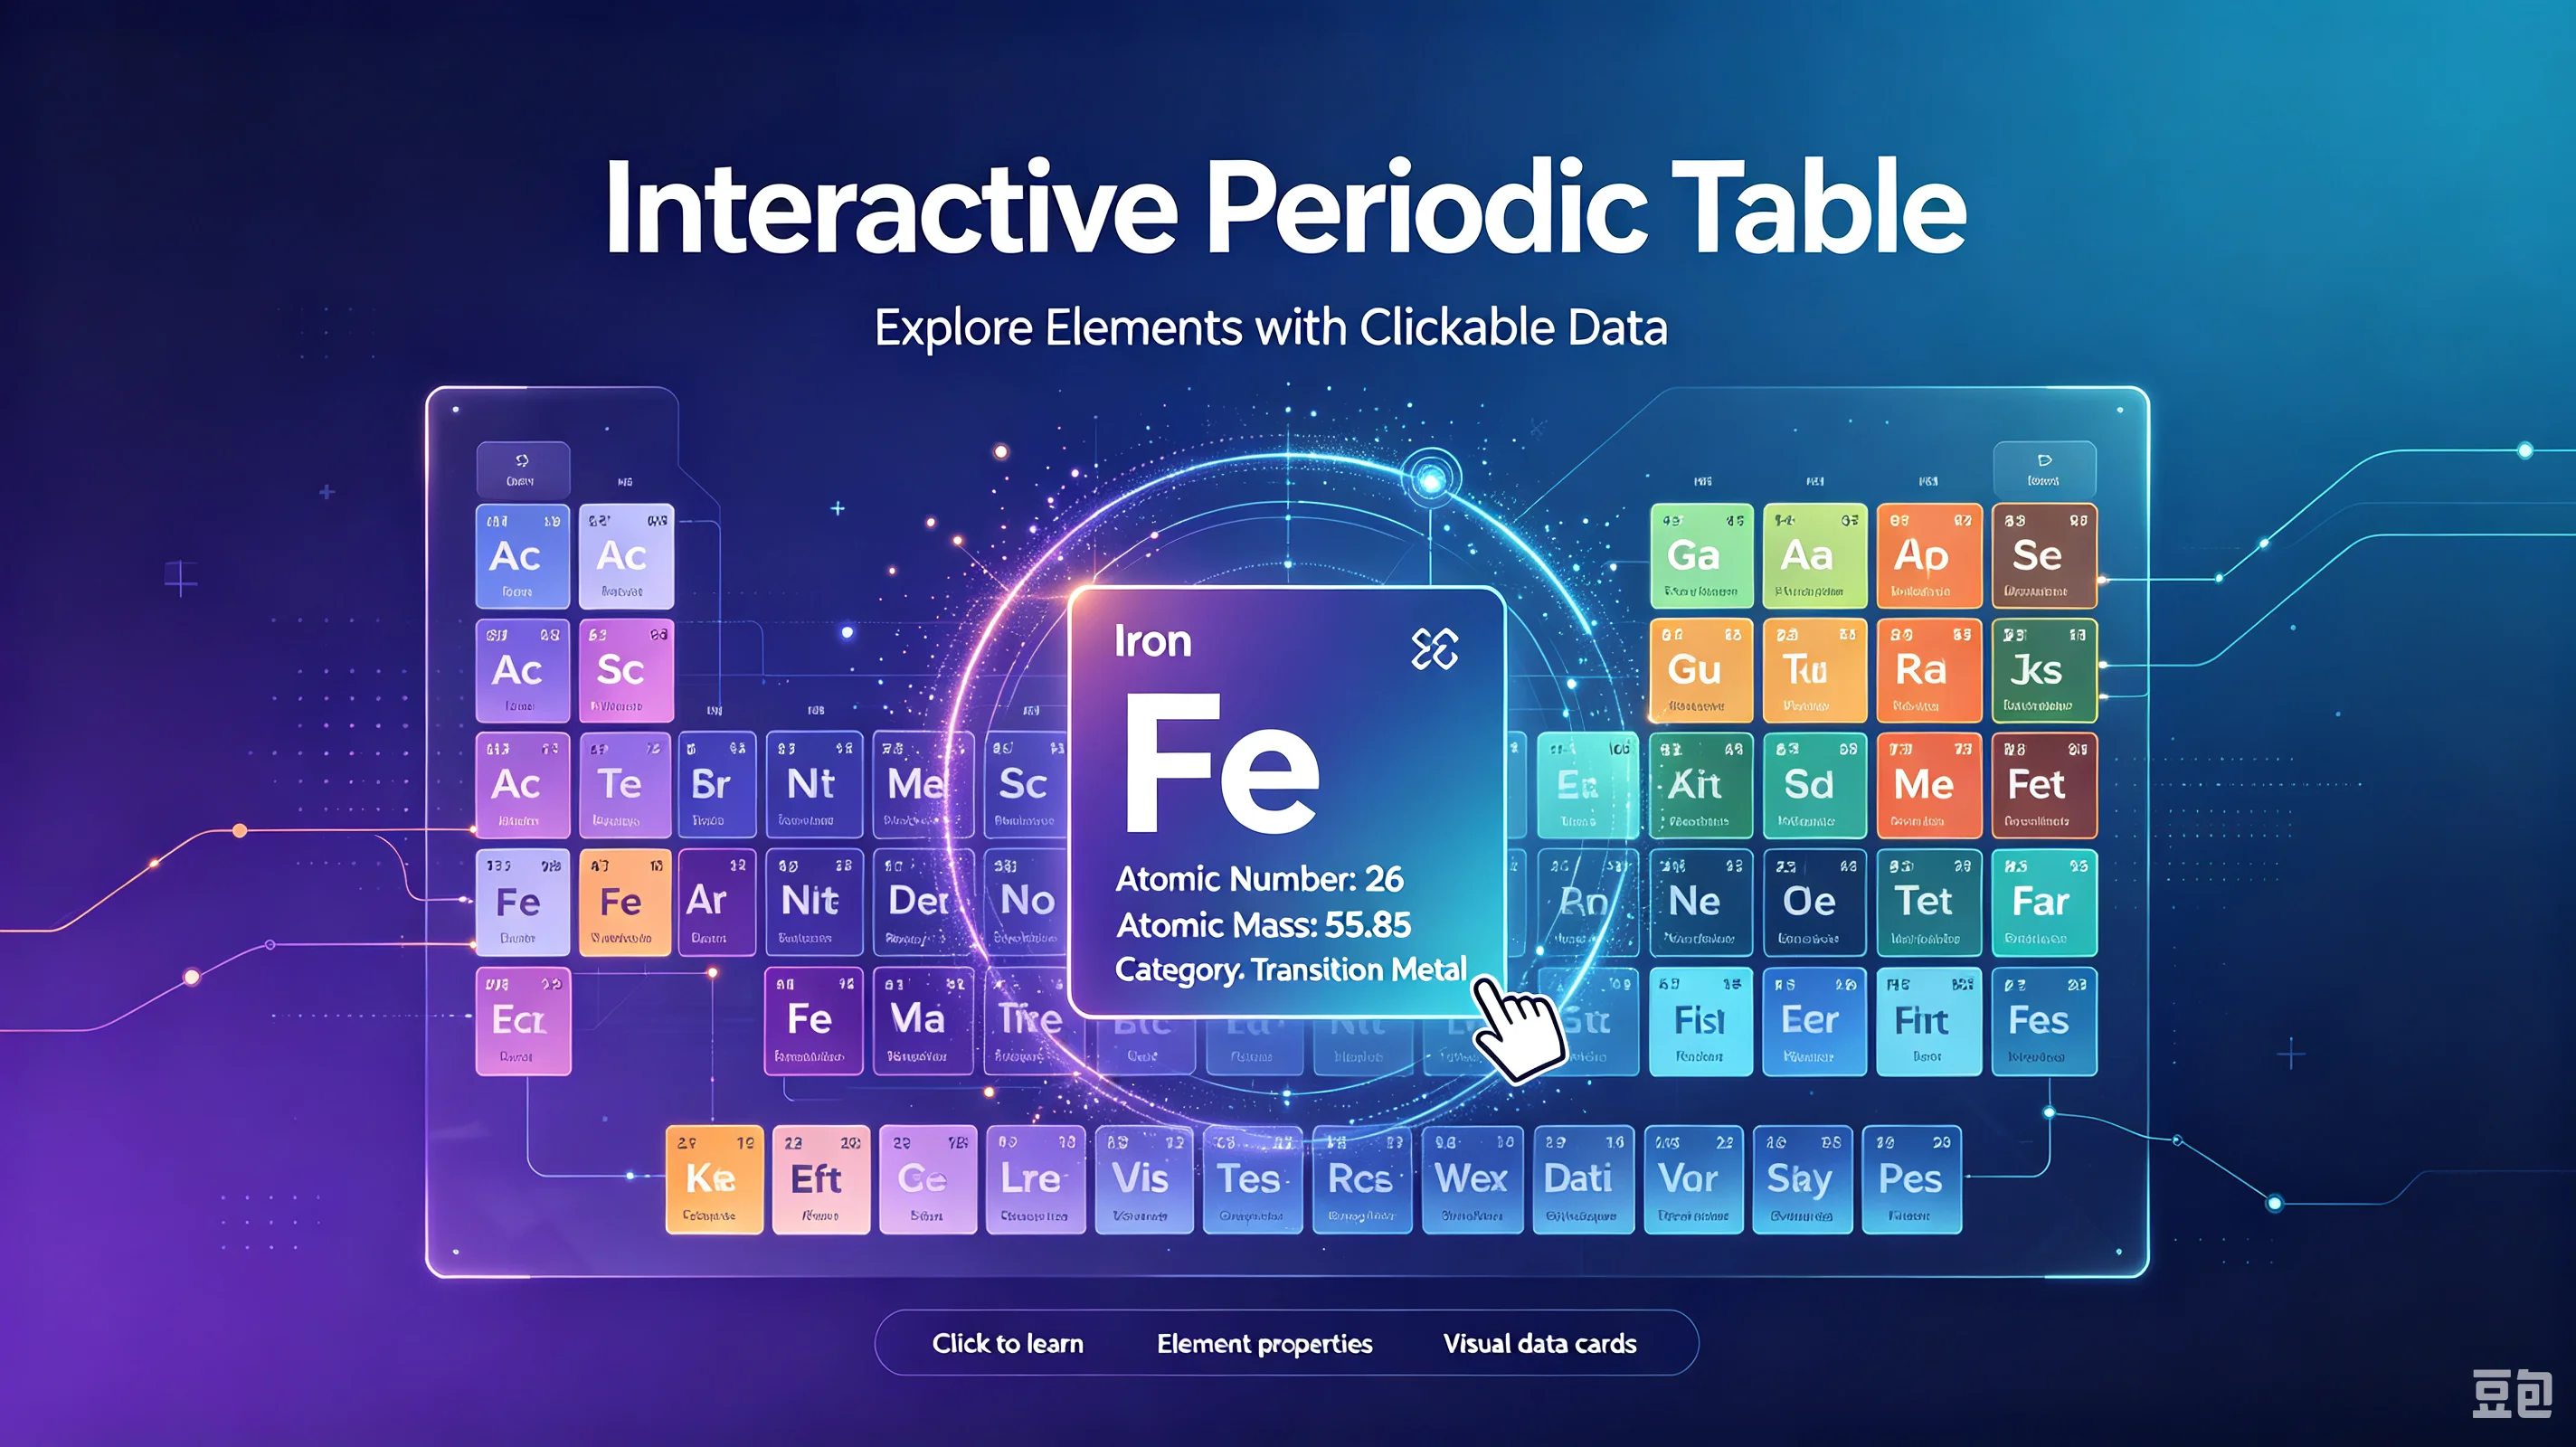
Click any element for full data. Each element tile opens a detail panel showing atomic number, symbol, name, atomic mass, electron configuration, oxidation states, electronegativity, melting point, boiling point, density, and phase at room temperature.
Color by property. Switch the color scheme to visualize trends:
By category — alkali metals, transition metals, metalloids, nonmetals, halogens, noble gases
By electronegativity — see which elements pull electrons hardest
By atomic radius — spot the trend of larger atoms down and left
By melting point — quickly find elements that are liquid or gaseous at room temp
Search and filter. Type an element name, symbol, or atomic number to jump directly to it. Filter by category to isolate, say, only the transition metals or only the noble gases.
Compare elements side by side. Select two or more elements and compare their properties in a table — useful for choosing between similar metals for an experiment or explaining why sodium and potassium behave alike.
How to Use It: A Quick Tutorial
Using an interactive periodic table is straightforward, but here's a workflow that gets the most out of it:
Step 1: Find your element. Type the symbol (e.g., "Fe") or name ("iron") in the search bar, or scan the table visually. The element tile highlights as you hover.
Step 2: Open the detail panel. Click the tile. You'll see the full data sheet — atomic mass, electron configuration, common oxidation states, and physical properties.
Step 3: Check electron configuration. For bonding problems, the electron configuration tells you valence electrons. For example, chlorine (Cl) is [Ne] 3s² 3p⁵ — 7 valence electrons, so it typically gains one electron to form Cl⁻.
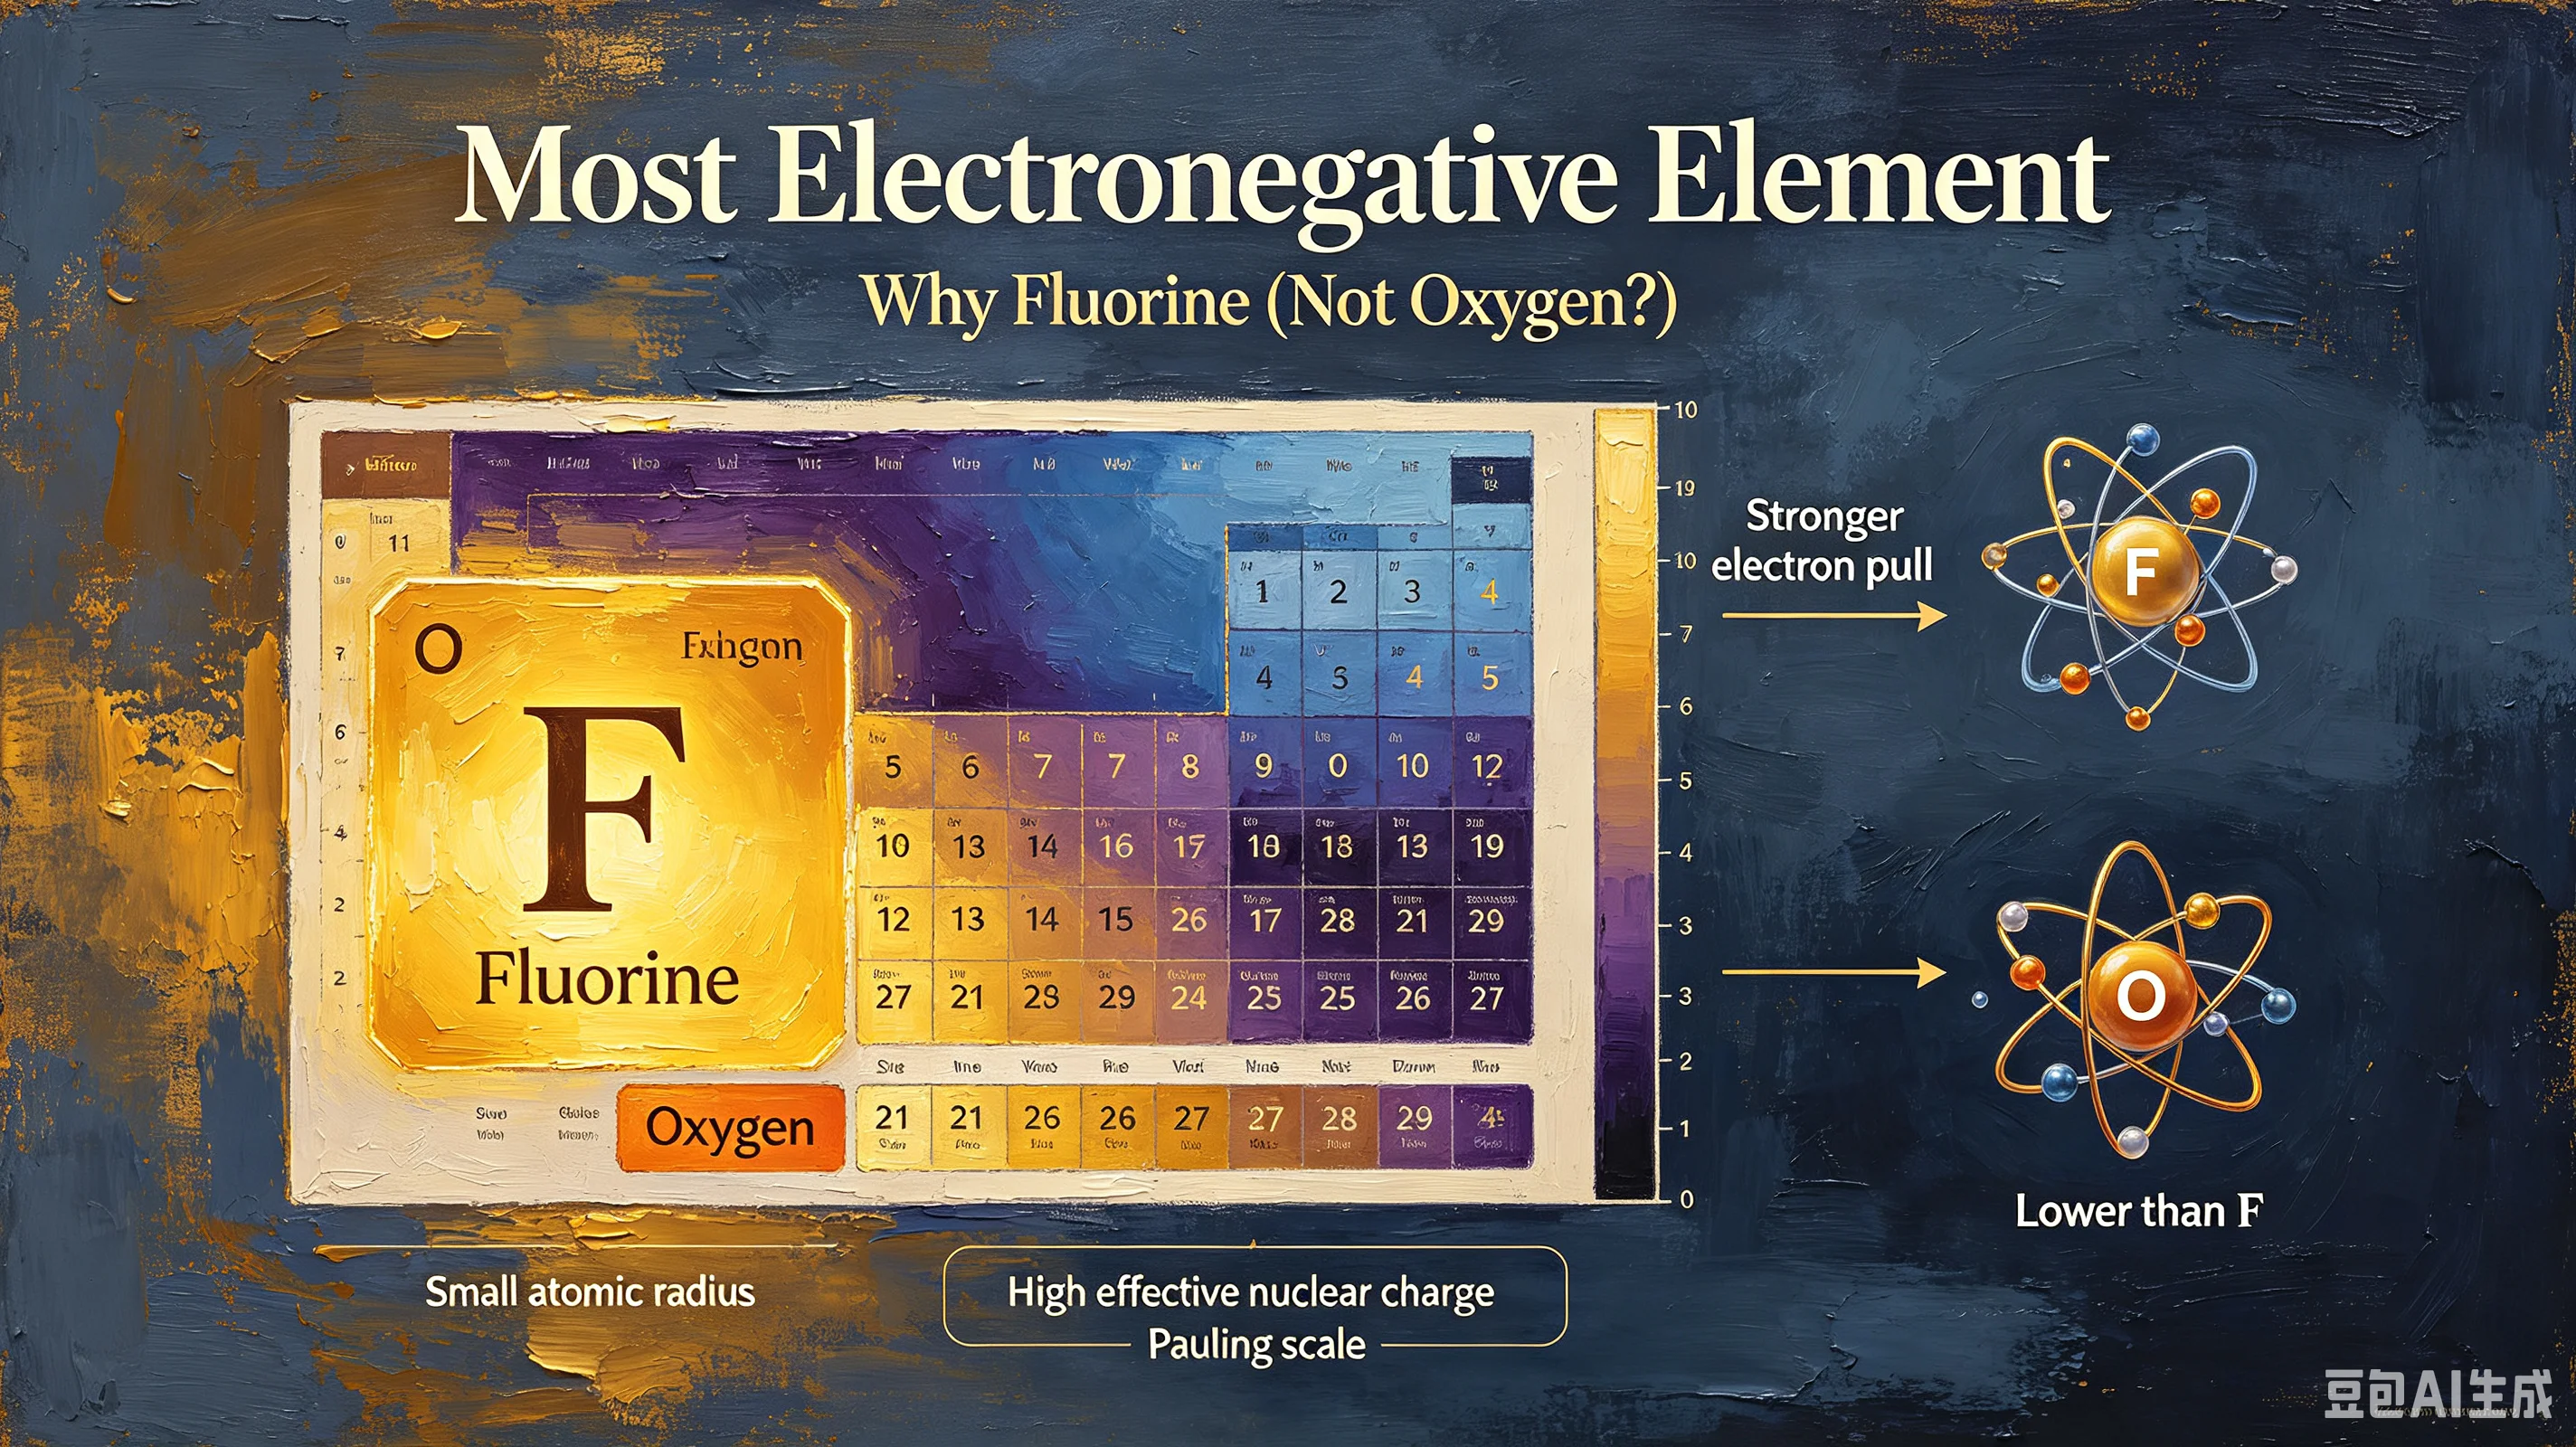
Step 4: Use trend coloring. If you're studying periodic trends, switch the color mode to electronegativity or atomic radius. The color gradient makes trends obvious: electronegativity increases toward the top-right (F is highest), atomic radius increases toward the bottom-left (Fr is largest).
Step 5: Export or reference. Jot down the data you need, or take a screenshot of the colored trend view for your notes.
Element Categories at a Glance
The periodic table organizes 118 elements into categories based on chemical behavior:
表格
Category | Location | Key Traits | Examples |
|---|---|---|---|
Alkali metals | Group 1 | Highly reactive, soft, +1 charge | Li, Na, K |
Alkaline earth metals | Group 2 | Reactive, +2 charge | Mg, Ca, Ba |
Transition metals | Groups 3–12 | Variable oxidation states, colored compounds | Fe, Cu, Au |
Post-transition metals | Groups 13–16 | Softer, lower melting points | Al, Pb, Sn |
Metalloids | Diagonal staircase | Semi-conducting, properties between metals and nonmetals | Si, Ge, As |
Nonmetals | Upper right | Brittle or gaseous, high electronegativity | C, N, O |
Halogens | Group 17 | Highly reactive nonmetals, -1 charge | F, Cl, Br |
Noble gases | Group 18 | Inert, full valence shell | He, Ne, Ar |
Lanthanides & Actinides | Bottom rows | Rare earth / radioactive | La, U, Pu |
An interactive table color-codes these categories automatically, so you can see at a glance which elements behave similarly.
Who Uses an Interactive Periodic Table?
Students — learning electron configurations, oxidation states, and periodic trends
Teachers — projecting a clickable table in class to demonstrate trends in real time
Lab chemists — quickly looking up melting points, densities, or oxidation states during experiments
Tutors — walking through bonding problems with visual data on hand
Hobbyists and citizen scientists — exploring element facts without a textbook
Tips for Getting the Most Out of It
Don't just memorize — use trends. If you understand that electronegativity increases up and right, you can predict bond polarity without looking up every value.
Check oxidation states for balancing. When balancing redox equations, click both elements to confirm their common oxidation states.
Use the category filter. If a problem asks about "alkali metals," filter to Group 1 and you'll see only the relevant elements.
Compare similar elements. When choosing between two metals for a reaction, compare their reactivity, melting point, and cost in a side-by-side view.
Start Exploring
Open the chembioTube Interactive Periodic Table — free, no signup, runs in your browser. Click any element for full data, color by property, and search in seconds.