Complete Pauling electronegativity chart for all elements. Learn periodic trends, how to calculate electronegativity difference, and predict ionic vs. covalent bonds. Interactive heatmap included.
Electronegativity is the single most useful concept for predicting how atoms will bond. It tells you whether two atoms will share electrons evenly, fight over them, or one will steal them outright. This guide covers the Pauling scale values, the periodic trends, and exactly how to use electronegativity difference to classify any chemical bond.
What Is Electronegativity?
Electronegativity (EN) is a measure of how strongly an atom attracts electrons in a chemical bond. When two atoms bond, the one with higher electronegativity pulls the shared electrons toward itself. This creates partial charges (δ+ and δ−) and determines whether the bond is nonpolar, polar, or ionic.
Electronegativity is not a directly measured physical property — it's a calculated scale. The most widely used scale was developed by Linus Pauling in 1932, based on bond energy data. The Pauling scale runs from roughly 0.7 to 4.0, with no units.
The Pauling Electronegativity Chart
Here are the Pauling electronegativity values for the most commonly referenced elements:
Element | Symbol | EN | Element | Symbol | EN |
|---|---|---|---|---|---|
Fluorine | F | 3.98 | Aluminum | Al | 1.61 |
Oxygen | O | 3.44 | Zinc | Zn | 1.65 |
Chlorine | Cl | 3.16 | Iron | Fe | 1.83 |
Nitrogen | N | 3.04 | Silicon | Si | 1.90 |
Bromine | Br | 2.96 | Boron | B | 2.04 |
Iodine | I | 2.66 | Hydrogen | H | 2.20 |
Sulfur | S | 2.58 | Phosphorus | P | 2.19 |
Carbon | C | 2.55 | Magnesium | Mg | 1.31 |
Selenium | Se | 2.55 | Calcium | Ca | 1.00 |
Gold | Au | 2.54 | Lithium | Li | 0.98 |
Copper | Cu | 1.90 | Sodium | Na | 0.93 |
Tin | Sn | 1.96 | Potassium | K | 0.82 |
Lead | Pb | 2.33 | Rubidium | Rb | 0.82 |
Hydrogen | H | 2.20 | Cesium | Cs | 0.79 |
Silver | Ag | 1.93 | Francium | Fr | 0.70 |
Key takeaways:
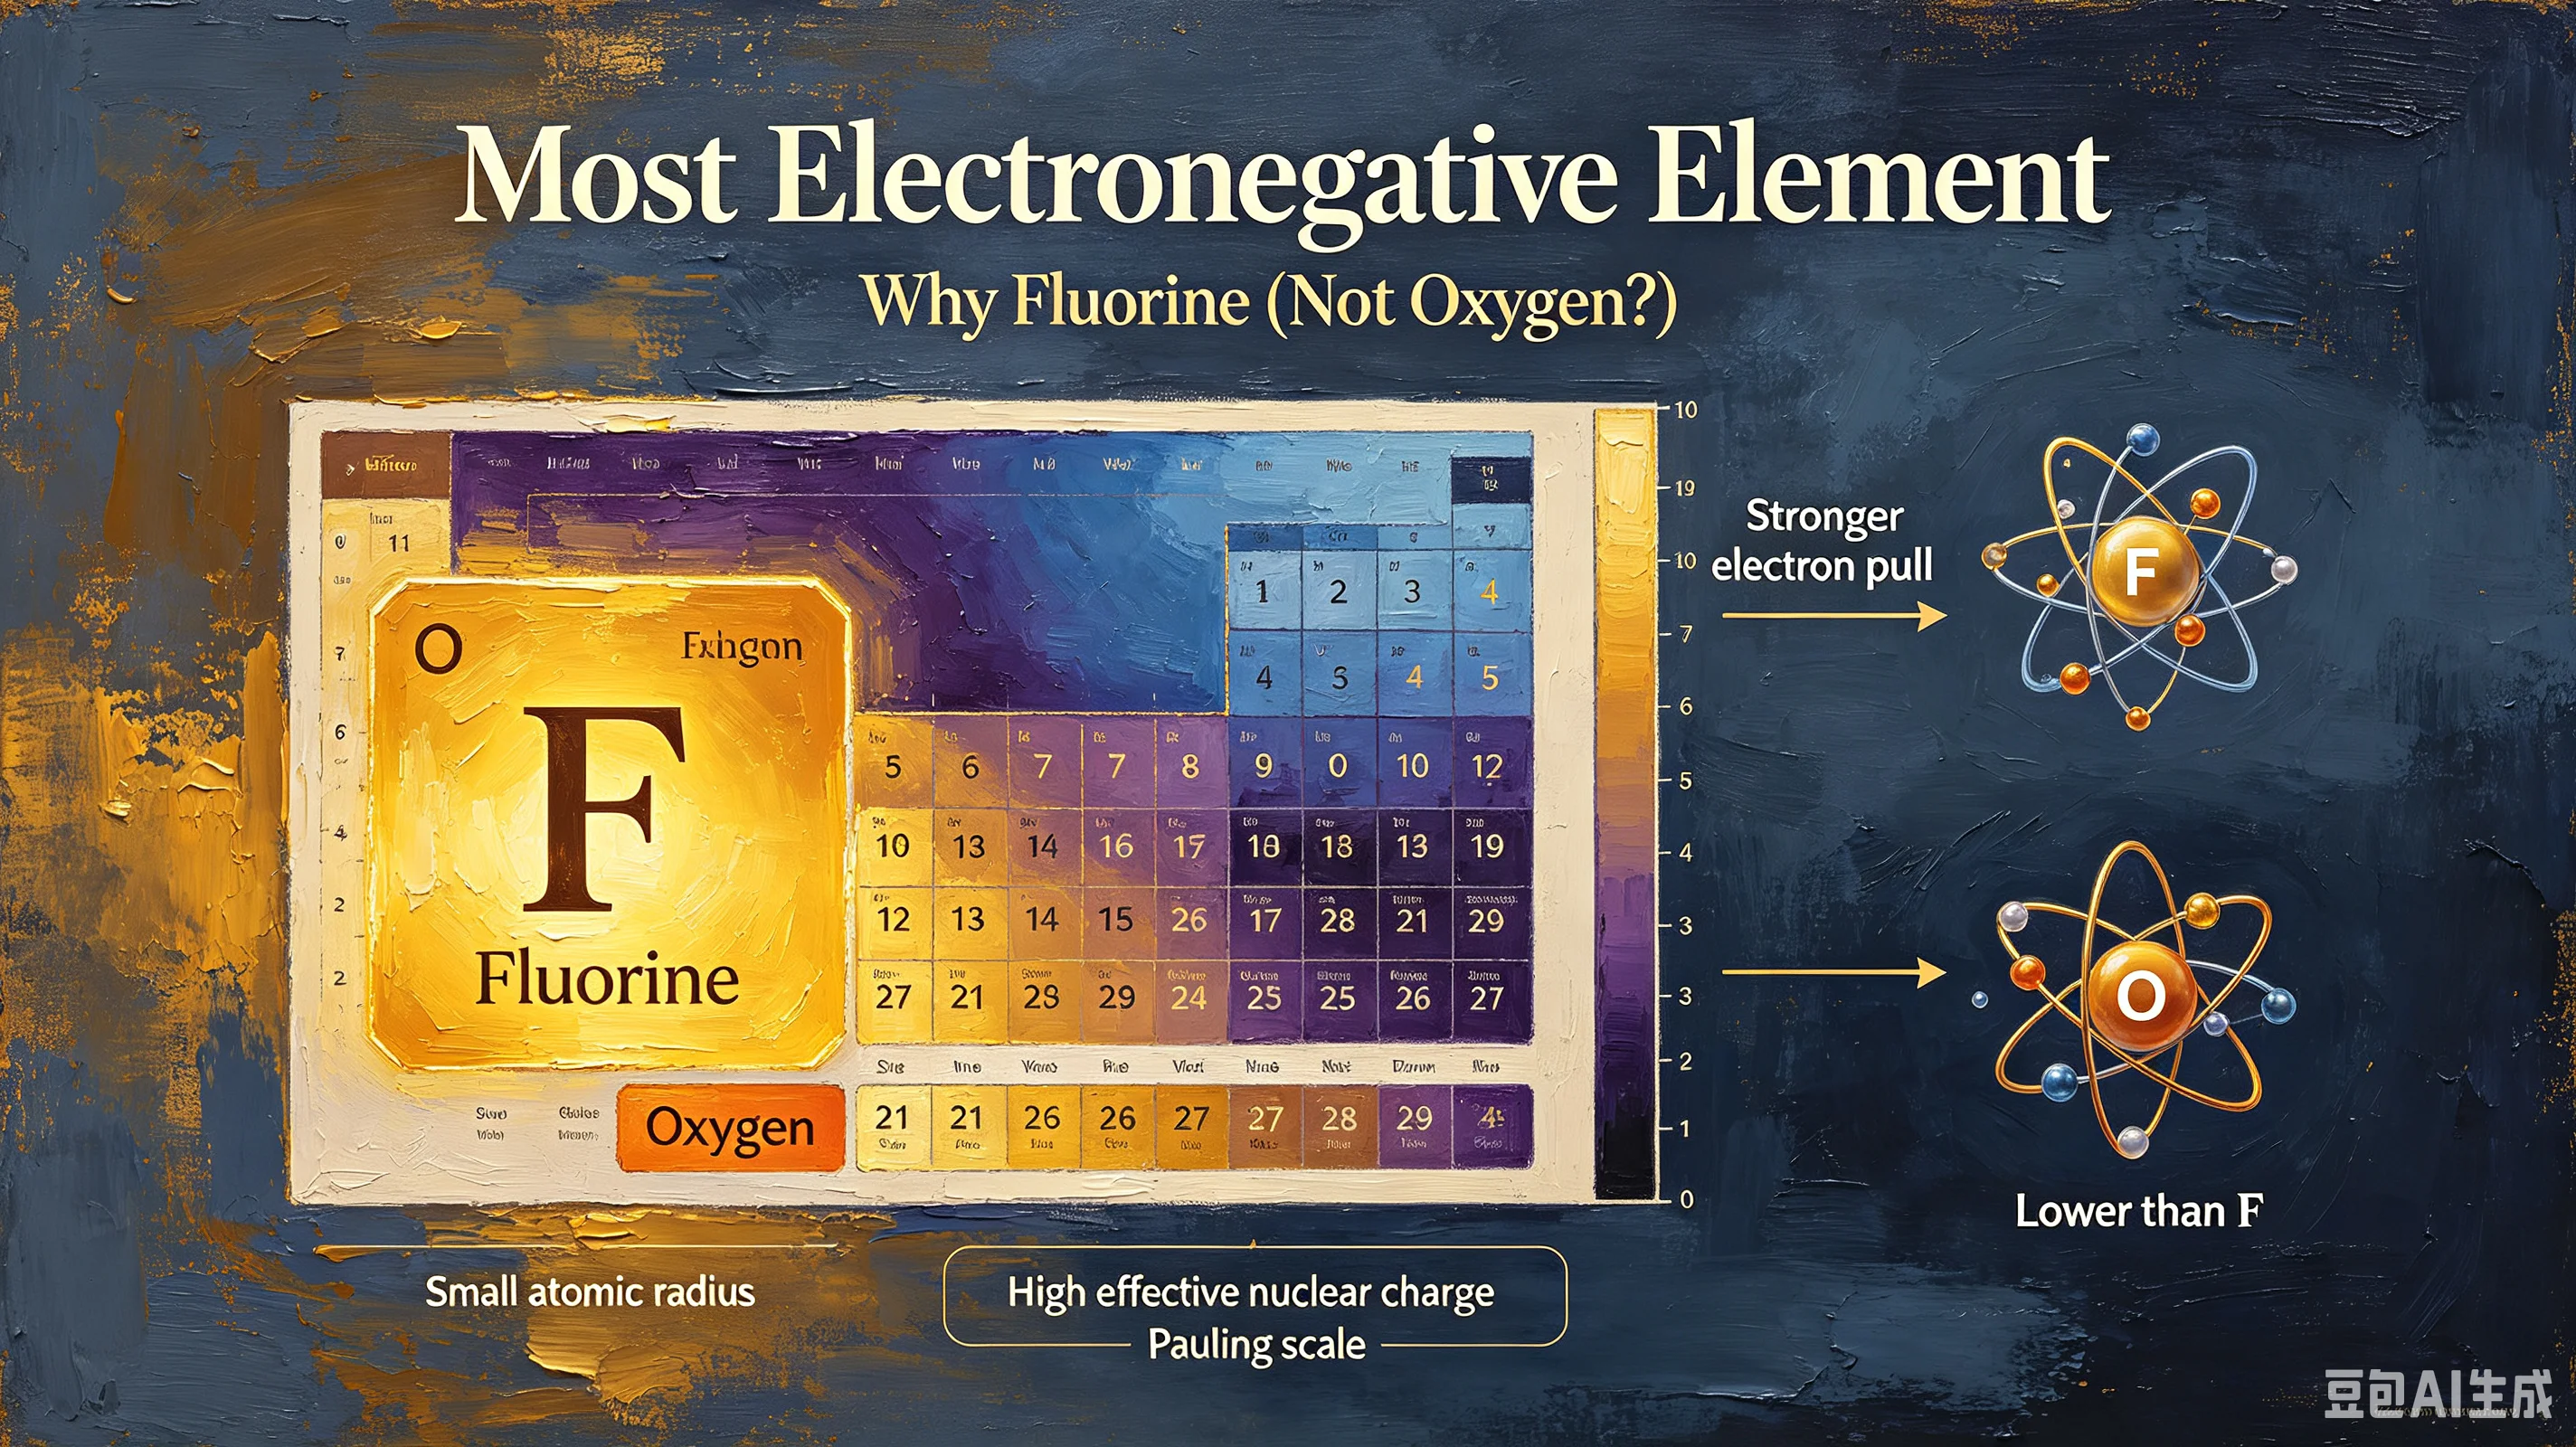
Fluorine (3.98) is the most electronegative element — it pulls electrons harder than anything else.
Francium (0.70) and cesium (0.79) are the least electronegative — they give up electrons easily.
Noble gases (He, Ne, Ar) generally don't have electronegativity values because they rarely form bonds.
Hydrogen (2.20) sits in the middle — it can act as either an electron donor (H⁺) or acceptor (H⁻).
Periodic Trends: The Two Rules
Electronegativity follows two simple patterns across the periodic table:
Rule 1: Increases from left to right across a period. As you move from Group 1 to Group 17, the nucleus gains protons while electrons stay in the same shell. More protons = stronger pull on bonding electrons. Example: Li (0.98) → Be (1.57) → B (2.04) → C (2.55) → N (3.04) → O (3.44) → F (3.98).
Rule 2: Decreases from top to bottom down a group. As you move down, electrons occupy shells farther from the nucleus. More distance = weaker pull. Example: F (3.98) → Cl (3.16) → Br (2.96) → I (2.66) → At (2.20).
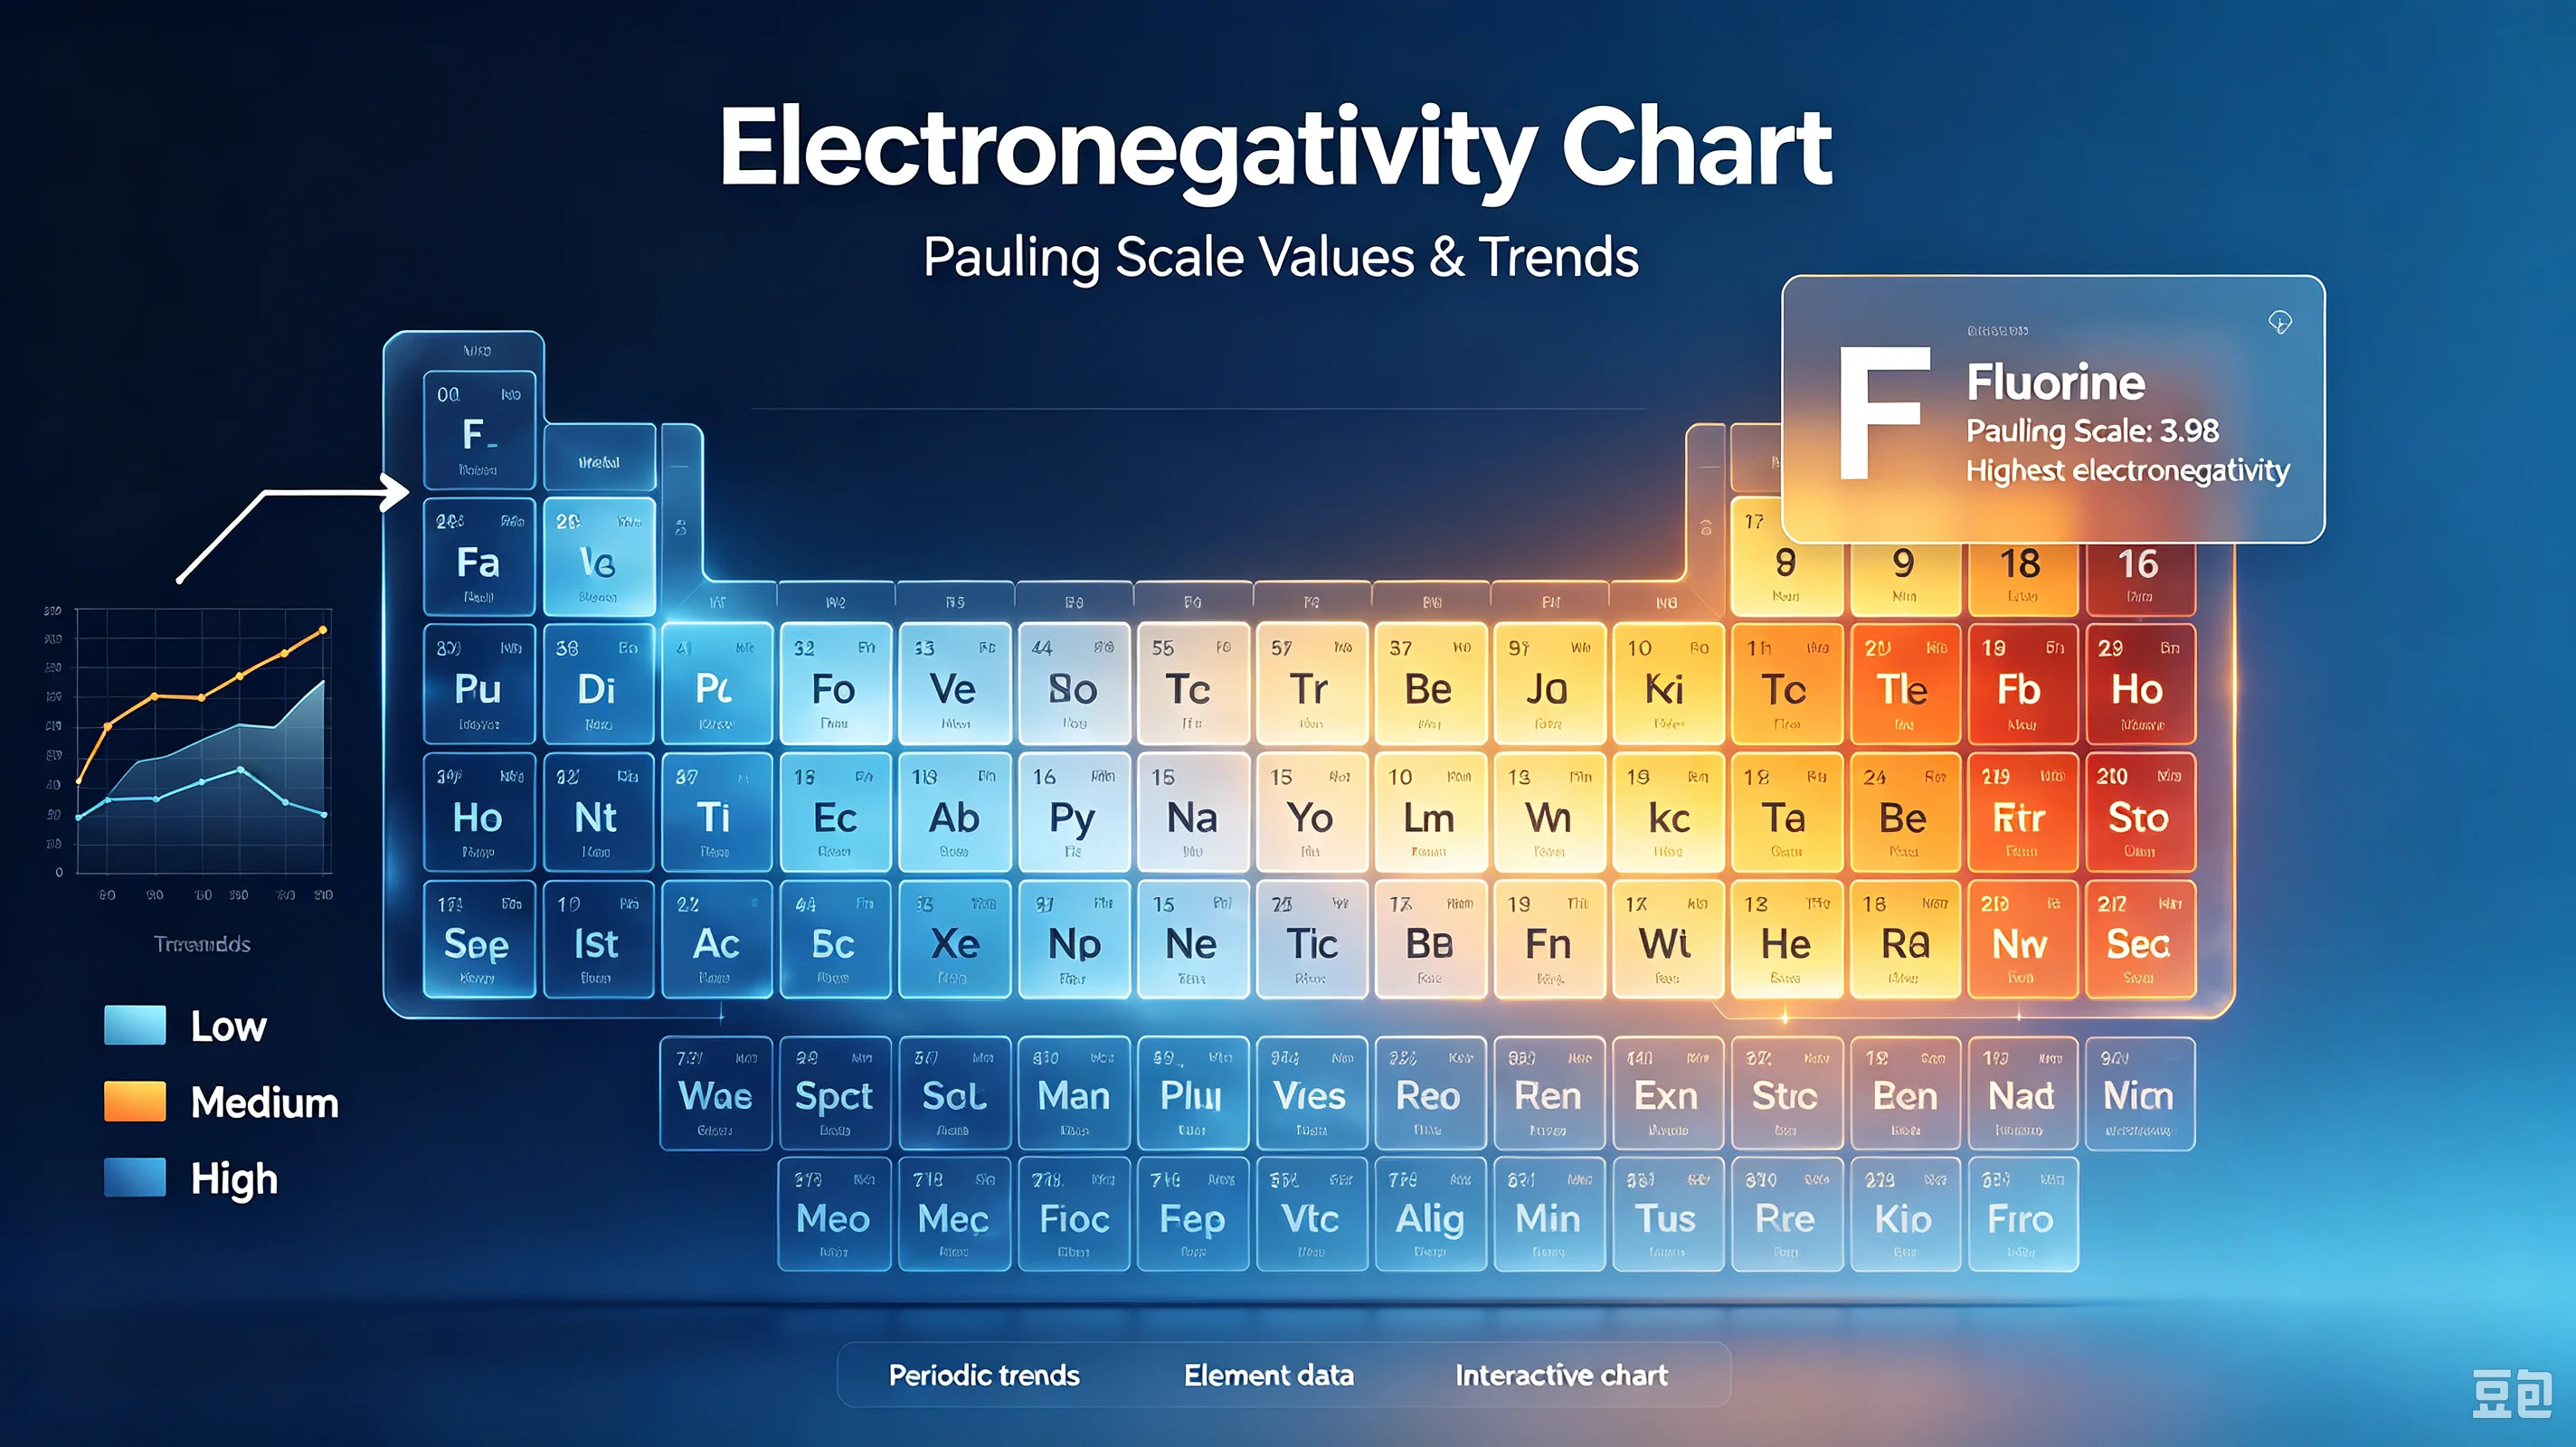
The result: fluorine (top-right) is the most electronegative, francium (bottom-left) is the least. An electronegativity heatmap makes this instantly visible — the color deepens toward the top-right corner and fades toward the bottom-left.
Why These Trends Exist
Both trends come down to effective nuclear charge and atomic radius:
Left to right: Protons are added to the nucleus, increasing the positive charge. Electrons are added to the same shell, so shielding doesn't increase much. The net pull on bonding electrons gets stronger.
Top to bottom: New electron shells are added, so bonding electrons are farther from the nucleus. Even though the nucleus has more protons, the increased distance and shielding reduce the pull.
Transition metals break the smooth trend slightly because d-electrons shield differently, but the overall left-to-right increase still holds.
How to Use Electronegativity Difference to Classify Bonds
The electronegativity difference (ΔEN) between two bonded atoms determines the bond type:
ΔEN Range | Bond Type | Character | Example |
|---|---|---|---|
0.0 – 0.4 | Nonpolar covalent | Electrons shared equally | H–H (0.0), C–H (0.35) |
0.5 – 1.7 | Polar covalent | Electrons shared unequally | H–Cl (0.96), O–H (1.24) |
> 1.7 | Ionic | Electron transferred | Na–Cl (2.23), K–F (3.16) |
Step-by-step method:
Look up the electronegativity of both atoms.
Subtract the smaller value from the larger (ΔEN = EN₁ − EN₂, always positive).
Compare to the ranges above.
Example 1: HCl
H = 2.20, Cl = 3.16
ΔEN = 3.16 − 2.20 = 0.96
0.96 falls in 0.5–1.7 → polar covalent bond. Chlorine pulls electrons harder, so the Cl end is δ− and the H end is δ+.
Example 2: NaCl
Na = 0.93, Cl = 3.16
ΔEN = 3.16 − 0.93 = 2.23
2.23 > 1.7 → ionic bond. Sodium essentially transfers an electron to chlorine, forming Na⁺ and Cl⁻.
Example 3: CH₄ (C–H bond)
C = 2.55, H = 2.20
ΔEN = 2.55 − 2.20 = 0.35
0.35 < 0.4 → nonpolar covalent bond. Electrons are shared almost evenly.
Note: The 1.7 threshold is a guideline, not a hard rule. Bonds with ΔEN around 1.5–2.0 have mixed ionic-covalent character. Some textbooks use 2.0 as the cutoff instead of 1.7.
Common Misconceptions
"Oxygen is the most electronegative element." No — fluorine (3.98) beats oxygen (3.44). This is why HF is more polar than H₂O, and why fluorine forms the strongest ionic bonds with metals.
"Electronegativity and electron affinity are the same thing." No. Electron affinity is the energy released when an atom gains an electron (a measurable physical property). Electronegativity is a calculated scale describing attraction in a bond. They correlate but aren't identical.
"Noble gases have zero electronegativity." Not exactly — they're usually left blank because they rarely form bonds. Heavy noble gases (Kr, Xe) can form compounds and do have assigned electronegativity values (Kr ≈ 3.00, Xe ≈ 2.60).
"A high ΔEN always means ionic." Generally yes, but there's a continuum. Even "ionic" compounds like NaCl have a small amount of covalent character. The 1.7 cutoff is a convenient dividing line, not a phase transition.
Visualize With an Electronegativity Heatmap
A table of numbers tells you the values, but a heatmap shows the trend at a glance. An interactive periodic table that colors each element by its electronegativity lets you:
See the top-right / bottom-left gradient instantly
Hover any element for its exact Pauling value
Compare adjacent elements to understand why bonds form the way they do
Switch between electronegativity, atomic radius, and melting point heatmaps to see how properties correlate
This visual approach is especially helpful for students learning periodic trends for the first time — the color pattern sticks in memory far better than a list of rules.
Start Exploring
Open the chembioTube Interactive Periodic Table and switch to the electronegativity heatmap. Click any element for its full Pauling value, compare elements side by side, and use the data to classify any bond. Free, no signup, runs in your browser.