Calculate GC content of any DNA sequence with the simple formula GC% = (G+C)/(A+T+G+C) × 100. Learn why GC% matters for PCR, sequencing, and primer design, plus typical GC ranges across organisms. Free calculator included.
GC content — the percentage of guanine (G) and cytosine (C) bases in a DNA sequence — is one of the most fundamental properties of any genome or gene. It affects PCR annealing temperatures, sequencing difficulty, gene prediction, and even how you identify an unknown organism. Yet calculating it is trivially simple: count the Gs and Cs, divide by total bases, multiply by 100. This guide covers the formula, a step-by-step calculation, why GC content matters in the lab, typical ranges across organisms, and common pitfalls like ambiguous bases and reverse complements.
The GC Content Formula
GC content is the fraction of bases in a DNA sequence that are either guanine or cytosine:
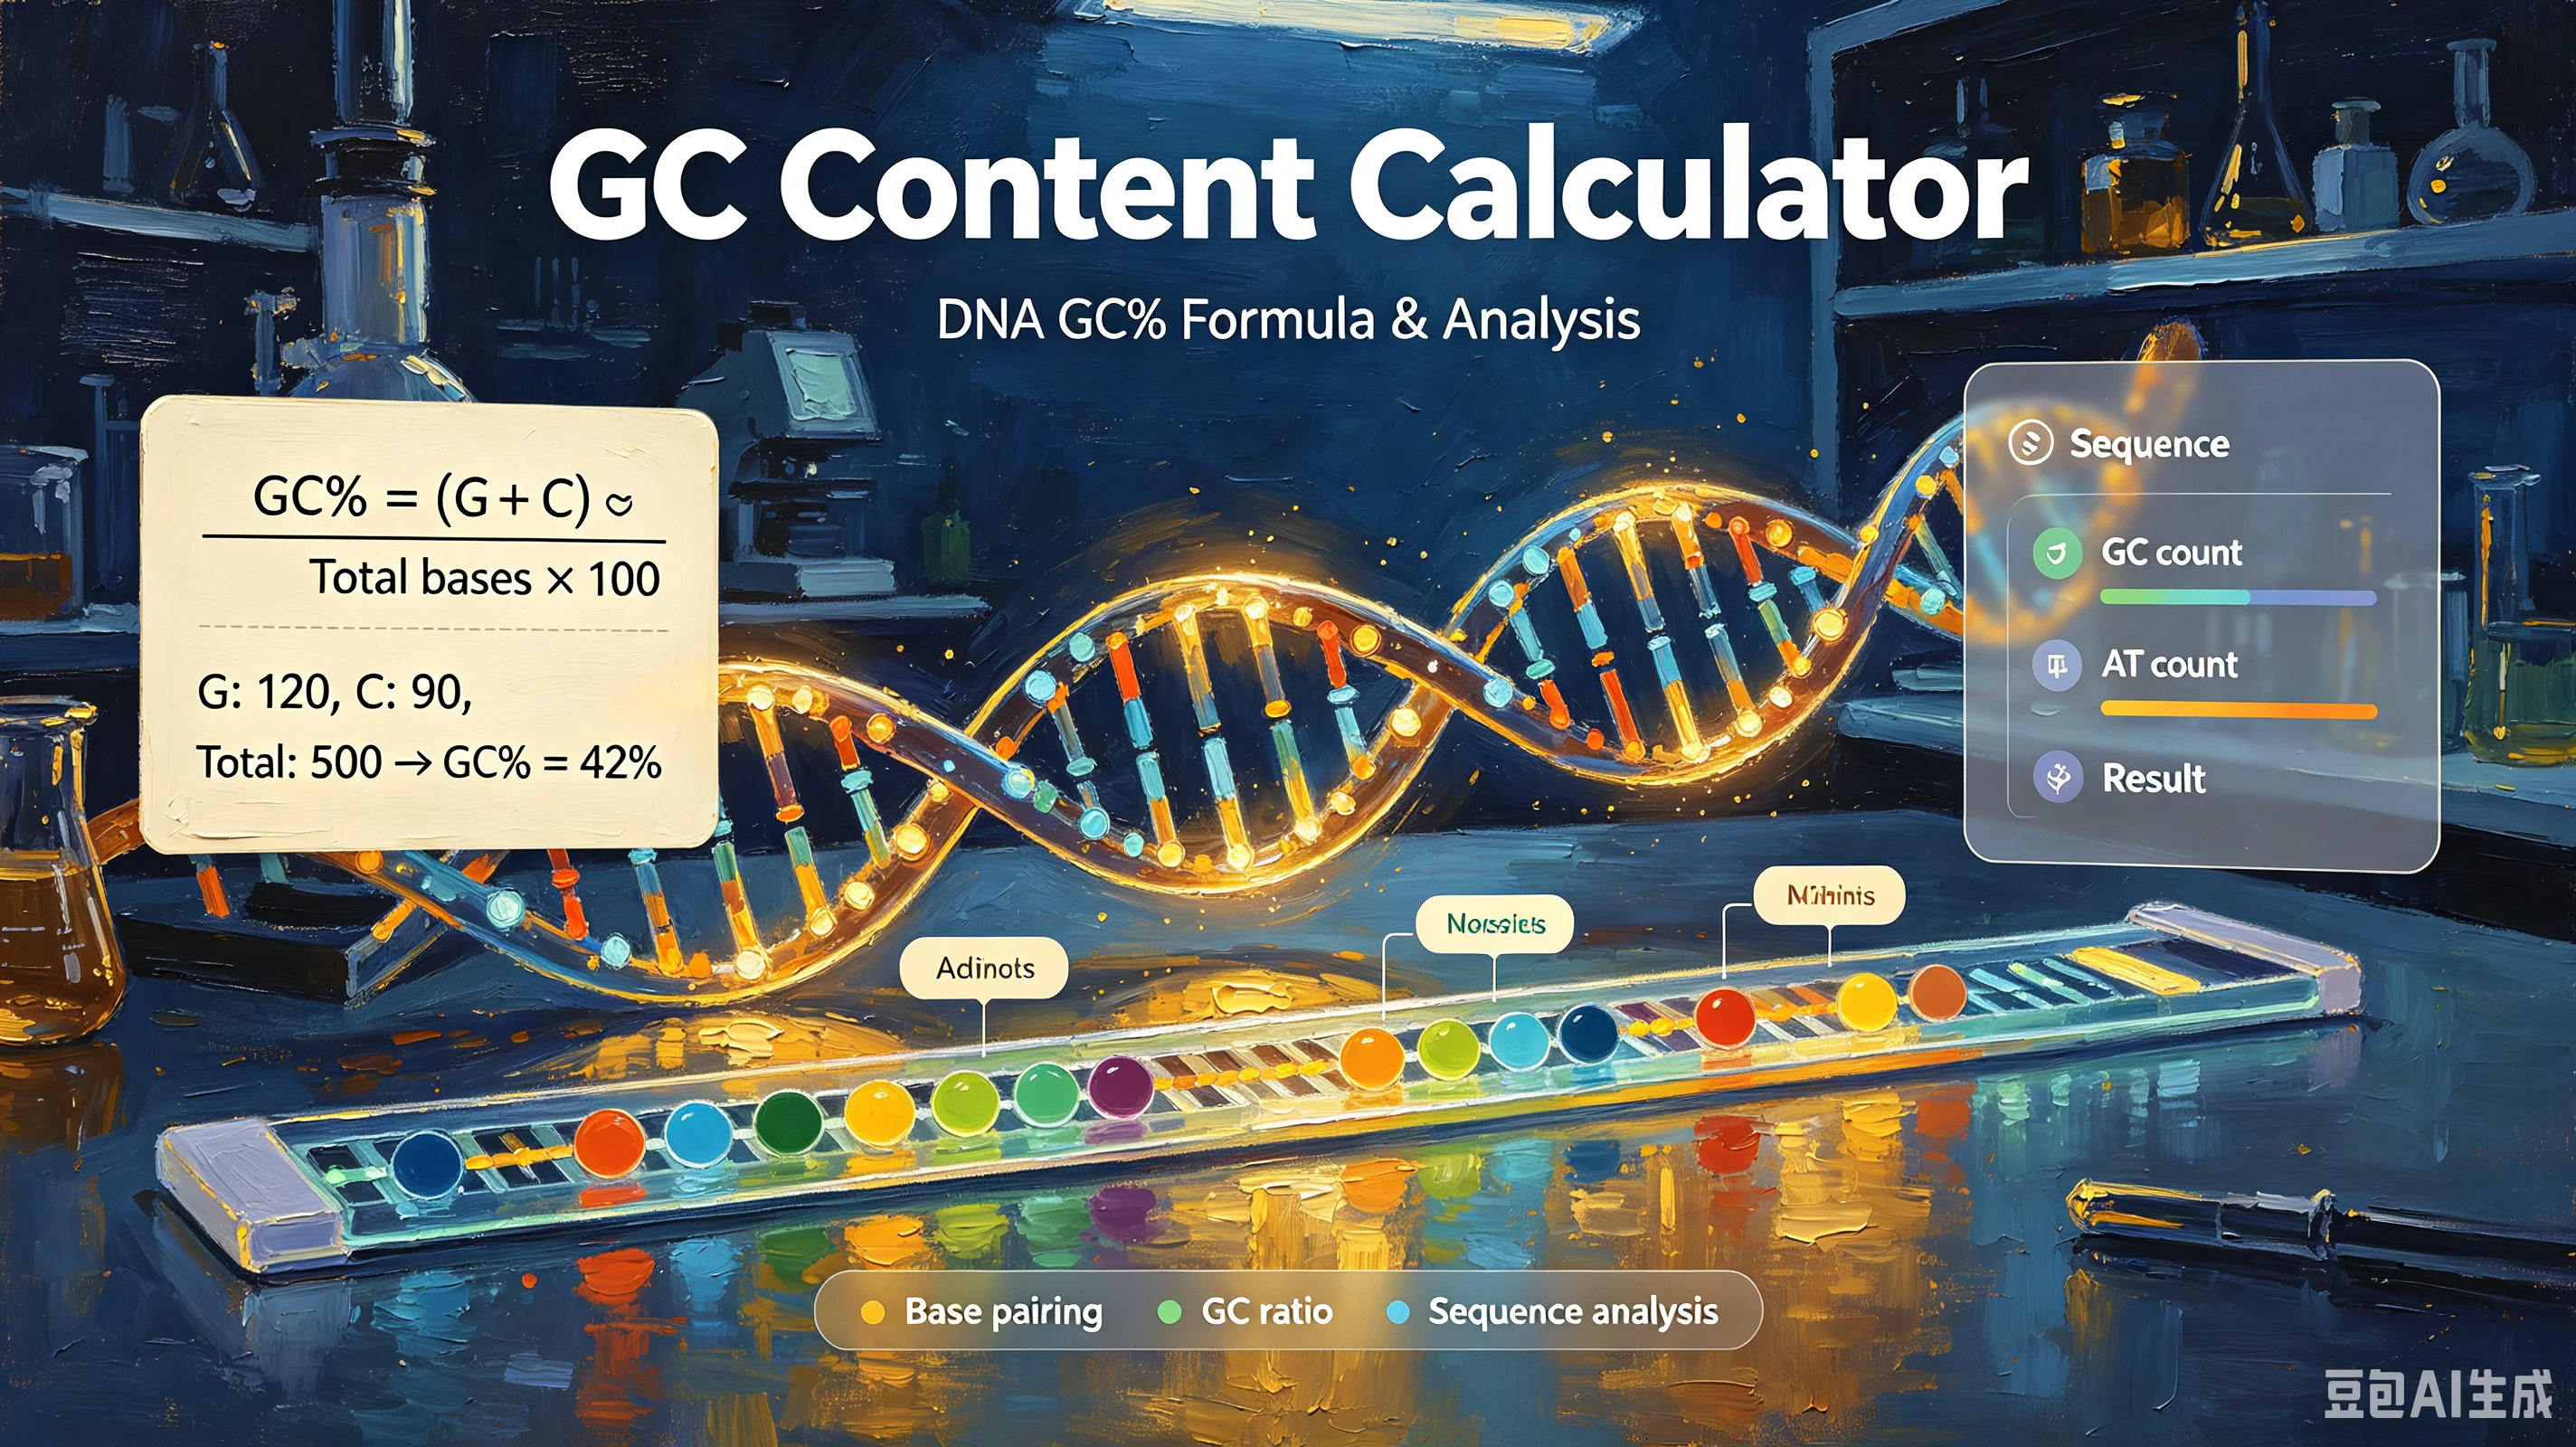
GC% = (Number of G + Number of C) / (Total number of bases) × 100
Or equivalently:
GC% = (G + C) / (A + T + G + C) × 100
Where A, T, G, C are the counts of each nucleotide.
Example: A 200-base sequence contains 45 A, 35 T, 60 G, 60 C.
GC% = (60 + 60) / (45 + 35 + 60 + 60) × 100 = 120 / 200 × 100 = 60%
The complementary strand has the same GC content, because every G pairs with a C and every C pairs with a G. So you only need to analyze one strand.
AT content is simply the inverse:
AT% = 100 − GC%
In the example above, AT% = 40%.
Step-by-Step Calculation
Step 1: Get your sequence.
Paste or type your DNA sequence. It can be in FASTA format (the header line starting with ">" is ignored) or raw sequence.
Step 2: Count each base.
Count the number of A, T, G, and C characters. Most calculators do this automatically. Case doesn't matter (uppercase and lowercase are both counted).
Step 3: Handle ambiguous bases.
If your sequence contains IUPAC ambiguity codes (R, Y, S, W, K, M, B, D, H, V, N), decide how to treat them:
N (any base): Usually excluded from total base count, or counted as 0.25 G + 0.25 C + 0.25 A + 0.25 T
S (G or C): Counts as 100% GC
W (A or T): Counts as 0% GC
R (A or G): Counts as 50% GC
Y (C or T): Counts as 50% GC
For most routine work, simply exclude ambiguous bases from the calculation and note the coverage.
Step 4: Apply the formula.
Plug the counts into GC% = (G + C) / Total × 100.
Step 5: Verify.
Sanity check: GC% should be between 0% and 100%. Most natural sequences fall between 20% and 70%. If you get 0% or 100%, check for counting errors or a sequence that's all one base type.
Why GC Content Matters
1. PCR and melting temperature (Tm).
The G–C base pair has three hydrogen bonds, while A–T has only two. More GC = more hydrogen bonds = higher melting temperature. A rough rule of thumb:
Tm ≈ 64.9 + 0.41 × GC% − 675 / primer_length
For short primers (<20 bp), the "2+4 rule" is common: Tm = 2°C × (A+T count) + 4°C × (G+C count). A primer with 60% GC will have a significantly higher Tm than one with 40% GC of the same length. Getting GC content right is essential for setting correct PCR annealing temperatures.
2. Sequencing difficulty.
High-GC regions (>65%) are notoriously hard to sequence. The strong G–C bonds cause secondary structures (hairpins, G-quadruplexes) that stall DNA polymerases. Low-GC regions (<30%) can also be problematic because they're AT-rich and prone to slippage. Many genomes have "GC deserts" or "GC islands" that require special sequencing chemistry.
3. Gene prediction and genome annotation.
In prokaryotes, protein-coding regions typically have higher GC content than non-coding regions. Gene-finding algorithms use GC content shifts (along with codon usage) to identify open reading frames. A sudden jump in GC% can indicate a horizontally transferred gene.
4. Species identification and taxonomy.
Different organisms have characteristic GC content ranges. If you sequence an unknown fragment and find it's 32% GC, you can narrow down the possible source. For bacteria, GC content is a standard taxonomic marker — closely related species usually have similar GC%.
5. Primer and probe design.
Good PCR primers typically have 40–60% GC content. Too high (>70%) and the primer may stick non-specifically; too low (<30%) and the Tm may be too low for standard PCR conditions. GC content also helps avoid primer-dimer formation and self-complementarity.
6. Evolutionary studies.
GC content varies across the tree of life and can reveal selective pressures. Thermophilic bacteria often have high GC (more stable DNA at high temperatures), while some parasites have extremely low GC (genome reduction and AT-bias).
Typical GC Content Ranges
表格
Organism / Genome | GC Content | Notes |
|---|---|---|
Plasmodium falciparum (malaria parasite) | ~19% | One of the lowest known eukaryotic genomes |
Human nuclear genome | ~41% | Relatively consistent across chromosomes |
Human mitochondrial DNA | ~44% | Slightly higher than nuclear |
E. coli | ~50–51% | Classic model bacterium |
Streptomyces coelicolor | ~72% | Very high GC soil bacterium |
Thermus thermophilus | ~69% | Thermophile, high GC for DNA stability |
Mycobacterium tuberculosis | ~65% | High GC pathogen |
Buchnera aphidicola (endosymbiont) | ~26% | Reduced genome, AT-biased |
Yeast (S. cerevisiae) | ~38% | Lower than most bacteria |
Arabidopsis thaliana (plant) | ~36% | Typical flowering plant |
The range is enormous: from ~19% (malaria parasite) to ~72% (Streptomyces). That's a 53-percentage-point spread, reflecting very different evolutionary pressures and genome architectures.
Sliding Window GC Analysis
For whole genomes or long sequences, average GC% isn't enough — you need to see variation along the sequence. A sliding window analysis calculates GC content in overlapping windows (e.g., 1,000 bp windows sliding by 100 bp each step) and plots the result. This reveals:
GC-rich islands — often coding regions, CpG islands (vertebrates), or horizontally transferred DNA
GC-poor deserts — often non-coding regions, heterochromatin, or AT-rich transposons
Isochores — large regions (>300 kb) of relatively uniform GC content, found in vertebrate genomes
Origin of replication — often associated with GC skew shifts (G vs C strand asymmetry)
A GC content calculator that supports sliding window output lets you visualize these patterns instead of just getting a single number.
Common Mistakes
Counting ambiguous bases as zero.
If your sequence has Ns (unknown bases) and you count them as A/T/G/C, you'll skew the result. Always either exclude Ns from the total or note how they were handled. A sequence that's 50% N has unreliable GC content regardless.
Forgetting that RNA uses U instead of T.
If you're analyzing RNA sequence (mRNA, rRNA), uracil (U) replaces thymine. The formula becomes GC% = (G + C) / (A + U + G + C) × 100. Most calculators auto-detect U and treat it as T-equivalent.
Analyzing the wrong strand.
GC content is the same on both strands (G pairs with C), so strand choice doesn't matter for total GC%. But for GC skew [(G−C)/(G+C)], strand matters — the leading and lagging strands of bacterial replication have opposite skew.
Using average GC% for primer design.
A 20-mer primer might average 50% GC but have a 3' end that's 80% GC or a 5' end that's 20% GC. For primers, check GC content in windows, especially the 3' annealing region.
Confusing GC content with GC skew.
GC content = (G+C)/total. GC skew = (G−C)/(G+C). They're different metrics. GC skew is used to identify replication origins in bacteria, not for Tm calculations.
Common Questions
What is a "good" GC content for PCR primers?
40–60% is the standard target range. This gives a Tm in the 55–65°C range, which works well for standard PCR. Aim for both primers in a pair to have similar GC% (within 5–10% of each other) so their Tms match.
Why do thermophiles have high GC content?
High GC content increases DNA melting temperature, which helps stabilize the genome at high growth temperatures. However, the relationship isn't perfect — some thermophiles have moderate GC, and protein stability (not just DNA) matters more for thermophily. GC content is one contributing factor, not the whole story.
Does GC content affect protein sequence?
Indirectly. Amino acids like alanine (GCX), glycine (GGX), and proline (CCX) are GC-rich codons, while lysine (AAA/AAG), isoleucine (ATX), and phenylalanine (TTY) are AT-rich. So a high-GC genome tends to encode proteins rich in alanine, glycine, and proline — and vice versa for low-GC genomes.
How accurate is the GC% to Tm relationship?
The 0.41°C per %GC rule is a rough approximation. Real Tm depends on salt concentration, primer concentration, sequence context (nearest-neighbor effects), and the presence of denaturants like DMSO or formamide. For precise Tm, use a nearest-neighbor calculator, not just GC%.
Can GC content be 0% or 100%?
Theoretically yes — a sequence of all A/T has 0% GC, and all G/C has 100% GC. In practice, natural sequences never hit these extremes. Even the most AT-rich genomes (Plasmodium, ~19%) still have some G and C. Synthetic sequences or simple repeats can approach the extremes.
Start Calculating
Use the chembioTube GC Content Calculator to analyze any DNA or RNA sequence instantly. Paste your sequence, get GC%, AT%, base counts, and per-base composition. Supports IUPAC ambiguity codes and sliding window analysis. Free, no signup, runs in your browser.